Reverse engineering is, of course, a tedious, time-consuming, and error-prone task. It requires a lot of concentration that I either do not have or do not care to invest in the RE task. That is why so many of my RE experiments are geared toward automating the task as much as possible. To that end, I am optimistic about this call/ret monitoring experiment since it yields such a good high-level overview of an algorithm contained in a binary (with debug symbols). But it can use some improvement(s):
- First and foremost, those (no symbol) entries need to go away. Seriously, the data is all in the binary module. But I did not know how to find relocation data for external functions. objdump could not handle it. However, Matthieu Castet clued me in to the readelf utility which cheerfully prints out external function relocation data. Type ‘man readelf’ for information on the command which is apparently part of the standard GNU development system. I should be able to parse this data in my specialized Perl script and use it in the final hierarchy output.
- The output will be revised so that it prints out C-like code. The reasoning behind this is to make it possible to collapse and expand nested blocks in certain editing tools.
- At the same time that the previous output is being generated, I also want to output a simple digraph data structure that can be fed into Graphviz package in order to generate a basic call graph.
Having laid down certain goals, I proceed to implement solutions…
And I am back! Addressing the goals above:
- Make the (no symbol) entries go away and replace them with meaningful external library identifiers: Success! I revised the experiment to leverage the readelf tool for relocation data. Further, iterations down into subfunctions of external calls are not mapped. E.g., malloc() may call several other functions, but those will not be mentioned.
- Make some C-like output that can be collapsed in various text-editing tools: Success! Here is some example output illustrating the first 2 points:
wmv2init();  /* 00031f8c, called from 80000000 */
{
  WMVideoDecInit();  /* 00031450, called from 00031fed */
  {
    malloc();  /* EXTERNAL, 000a9600, called from 00031466 */
    {
    }
    memset();  /* EXTERNAL, 000ae660, called from 0003149f */
    {
    }
    malloc();  /* EXTERNAL, 000a9600, called from 000314b4 */
    {
    }
    BS_construct();  /* 0002da10, called from 000314e4 */
    {
    }
    WMVInternalMemberInit();  /* 00031b44, called from 0003151b */
    {
      VodecConstruct();  /* 000247e0, called from 00031b96 */
      {
        Huffman_WMV_construct();  /* 0001fe50, called from 0002486c */
        {
        }
As a bonus, the comments kindly explained where the function is located in the binary module and where it was called from. The latter bit of data is useful for understanding that a particular function is called repeatedly in a loop.
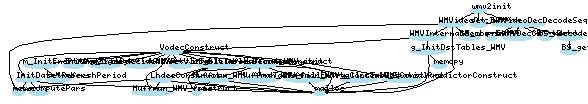
- Output data that can be graphed using Graphviz: Err, well… I generated data in the format the Graphviz wants but I still need to learn the finer points of tweaking the parameters so the graph looks readable. But don’t take my word for it; judge for yourself:
Want to see some raw data? Download re-data-libwmv8.tar.bz2 (~35K compressed, ~14M decompressed). I ran the experiments with 3 sets of sample data:
- wmv2init() function
- wmv2packet() function decoding frame #0 of a particular WMV2 video (an I-frame)
- wmv2packet() function decoding frame #18 of a particular WMV2 video (designated as a J-frame in Michael Niedermayer’s MS MPEG-4 document and not completely reverse engineered yet, which is why this experiment takes a particular interest in them)
Each data set has 3 associated files:
- -callret.txt file: This has the raw call & ret data output from the custom tool. Each line specifies <called address> call <called from address> for a call instruction or <returning address> ret for a return instruction. The last 2 lines in the file print the total number of calls and rets in the run; ideally, these 2 numbers should be the same.
- .c file: A C-like representation as illustrated above, depicting the call/ret data.
- .graph file: A text file with a graph data structure to be fed into Graphviz. If anyone can give me some tips on making the graphs look right, I would be appreciative. BTW, I just used the basic command ‘dot -Tpng file.graph > graph.png’
Have fun looking at all the data!